volatility2的使用
1
2
3
4
5
6
7
8
9
10
11
12
13
14
15
16
17
18
19
20
21
22
23
24
25
26
27
28
29
30
31
32
33
34
35
36
37
38
39
40
41
42
43
44
45
46
47
48
49
50
51
52
53
54
55
56
57
58
59
60
61
62
63
64
65
66
67
68
69
70
71
72
73
74
75
76
77
78
79
80
81
82
83
84
85
86
87
88
89
90
91
92
93
94
95
96
97
98
99
100
101
102
103
104
105
106
107
108
109
110
111
112
113
114
115
116
117
118
119
120
121
122
123
124
125
126
127
128
129
130
131
132
133
134
135
136
137
138
139
140
141
142
143
144
145
146
147
148
149
150
151
152
153
154
155
156
| Volatility取证分析工具
关于工具
简单描述
Volatility是一款开源内存取证框架,能够对导出的内存镜像进行分析,通过获取内核数据结构,使用插件获取内存的详细情况以及系统的运行状态。
特点:
开源:Python编写,易于和基于python的主机防御框架集成。
支持多平台:Windows,Mac,Linux全支持
易于扩展:通过插件来扩展Volatility的分析能力
项目地址
https://github.com/volatilityfoundation/volatility
Kali安装
sudo apt-get install volatility
volatility -h
流程图
常用模块
插件名称 功能
amcache 查看AmCache应用程序痕迹信息
apihooks 检测内核及进程的内存空间中的API hook
atoms 列出会话及窗口站atom表
atomscan Atom表的池扫描(Pool scanner)
auditpol 列出注册表HKLMSECURITYPolicyPolAdtEv的审计策略信息
bigpools 使用BigPagePoolScanner转储大分页池(big page pools)
bioskbd 从实时模式内存中读取键盘缓冲数据(早期电脑可以读取出BIOS开机密码)
cachedump 获取内存中缓存的域帐号的密码哈希
callbacks 打印全系统通知例程
clipboard 提取Windows剪贴板中的内容
cmdline 显示进程命令行参数
cmdscan 提取执行的命令行历史记录(扫描_COMMAND_HISTORY信息)
connections 打印系统打开的网络连接(仅支持Windows XP 和2003)
connscan 打印TCP连接信息
consoles 提取执行的命令行历史记录(扫描_CONSOLE_INFORMATION信息)
crashinfo 提取崩溃转储信息
deskscan tagDESKTOP池扫描(Poolscaner)
devicetree 显示设备树信息
dlldump 从进程地址空间转储动态链接库
dlllist 打印每个进程加载的动态链接库列表
driverirp IRP hook驱动检测
drivermodule 关联驱动对象至内核模块
driverscan 驱动对象池扫描
dumpcerts 提取RAS私钥及SSL公钥
dumpfiles 提取内存中映射或缓存的文件
dumpregistry 转储内存中注册表信息至磁盘
editbox 查看Edit编辑控件信息 (Listbox正在实验中)
envars 显示进程的环境变量
eventhooks 打印Windows事件hook详细信息
evtlogs 提取Windows事件日志(仅支持XP/2003)
filescan 提取文件对象(file objects)池信息
gahti 转储用户句柄(handle)类型信息
gditimers 打印已安装的GDI计时器(timers)及回调(callbacks)
gdt 显示全局描述符表(Global Deor Table)
getservicesids 获取注册表中的服务名称并返回SID信息
getsids 打印每个进程的SID信息
handles 打印每个进程打开的句柄的列表
hashdump 转储内存中的Windows帐户密码哈希(LM/NTLM)
hibinfo 转储休眠文件信息
hivedump 打印注册表配置单元信息
hivelist 打印注册表配置单元列表
hivescan 注册表配置单元池扫描
hpakextract 从HPAK文件(Fast Dump格式)提取物理内存数据
hpakinfo 查看HPAK文件属性及相关信息
idt 显示中断描述符表(Interrupt Deor Table)
iehistory 重建IE缓存及访问历史记录
imagecopy 将物理地址空间导出原生DD镜像文件
imageinfo 查看/识别镜像信息
impscan 扫描对导入函数的调用
joblinks 打印进程任务链接信息
kdbgscan 搜索和转储潜在KDBG值
kpcrscan 搜索和转储潜在KPCR值
ldrmodules 检测未链接的动态链接DLL
lsadump 从注册表中提取LSA密钥信息(已解密)
machoinfo 转储Mach-O 文件格式信息
malfind 查找隐藏的和插入的代码
mbrparser 扫描并解析潜在的主引导记录(MBR)
memdump 转储进程的可寻址内存
memmap 打印内存映射
messagehooks 桌面和窗口消息钩子的线程列表
mftparser 扫描并解析潜在的MFT条目
moddump 转储内核驱动程序到可执行文件的示例
modscan 内核模块池扫描
modules 打印加载模块的列表
multiscan 批量扫描各种对象
mutantscan 对互斥对象池扫描
notepad 查看记事本当前显示的文本
objtypescan 扫描窗口对象类型对象
patcher 基于页面扫描的补丁程序内存
poolpeek 可配置的池扫描器插件
printkey 打印注册表项及其子项和值
privs 显示进程权限
procdump 进程转储到一个可执行文件示例
pslist 按照EPROCESS列表打印所有正在运行的进程
psscan 进程对象池扫描
pstree 以树型方式打印进程列表
psxview 查找带有隐藏进程的所有进程列表
qemuinfo 转储Qemu 信息
raw2dmp 将物理内存原生数据转换为windbg崩溃转储格式
screenshot 基于GDI Windows的虚拟屏幕截图保存
servicediff Windows服务列表(ala Plugx)
sessions _MM_SESSION_SPACE的详细信息列表(用户登录会话)
shellbags 打印Shellbags信息
shimcache 解析应用程序兼容性Shim缓存注册表项
shutdowntime 从内存中的注册表信息获取机器关机时间
sockets 打印已打开套接字列表
sockscan TCP套接字对象池扫描
ssdt 显示SSDT条目
strings 物理到虚拟地址的偏移匹配(需要一些时间,带详细信息)
svcscan Windows服务列表扫描
symlinkscan 符号链接对象池扫描
thrdscan 线程对象池扫描
threads 调查_ETHREAD 和_KTHREADs
timeliner 创建内存中的各种痕迹信息的时间线
timers 打印内核计时器及关联模块的DPC
truecryptmaster 恢复TrueCrypt 7.1a主密钥
truecryptpassphrase 查找并提取TrueCrypt密码
truecryptsummary TrueCrypt摘要信息
unloadedmodules 打印卸载的模块信息列表
userassist 打印注册表中UserAssist相关信息
userhandles 转储用户句柄表
vaddump 转储VAD数据为文件
vadinfo 转储VAD信息
vadtree 以树形方式显示VAD树信息
vadwalk 显示遍历VAD树
vboxinfo 转储Virtualbox信息(虚拟机)
verinfo 打印PE镜像中的版本信息
vmwareinfo 转储VMware VMSS/VMSN 信息
volshell 内存镜像中的shell
windows 打印桌面窗口(详细信息)
wintree Z顺序打印桌面窗口树
wndscan 池扫描窗口站
yarascan 以Yara签名扫描进程或内核内存
常用命令
功能 命令行及参数
查看进程列表 Vol.exe -f Win7_SP1_x86.vmem –profile=Win7SP1x86 pslist
查看进程列表(树形) Vol.exe -f Win7_SP1_x86.vmem –profile=Win7SP1x86 pstree
查看进程列表(psx视图) Vol.exe -f Win7_SP1_x86.vmem –profile=Win7SP1x86 psxview
查看网络通讯连接 Vol.exe -f Win7_SP1_x86.vmem –profile=Win7SP1x86 netscan
查看加载的动态链接库 Vol.exe -f Win7_SP1_x86.vmem –profile=Win7SP1x86 dlllist
查看SSDT表 Vol.exe -f Win7_SP1_x86.vmem –profile=Win7SP1x86 ssdt
查看UserAssist痕迹 Vol.exe -f Win7_SP1_x86.vmem –profile=Win7SP1x86 userassist
查看ShimCache痕迹 Vol.exe -f Win7_SP1_x86.vmem –profile=Win7SP1x86 shimcache
查看ShellBags Vol.exe -f Win7_SP1_x86.vmem –profile=Win7SP1x86 shellbags
查看服务列表 Vol.exe -f Win7_SP1_x86.vmem –profile=Win7SP1x86 svcscan
查看Windows帐户hash Vol.exe -f Win7_SP1_x86.vmem –profile=Win7SP1x86 hashdump
查看最后关机时间 Vol.exe -f Win7_SP1_x86.vmem –profile=Win7SP1x86 shutdowntime
查看IE历史记录 Vol.exe -f Win7_SP1_x86.vmem –profile=Win7SP1x86 iehistory
提取注册表数据 Vol.exe -f Win7_SP1_x86.vmem –profile=Win7SP1x86 dumpregistry
解析MFT记录 Vol.exe -f Win7_SP1_x86.vmem –profile=Win7SP1x86 mftparser
导出MFT记录,恢复文件 Vol.exe -f Win7_SP1_x86.vmem –profile=Win7SP1x86 mftparser –output-file=mftverbose.txt -D mftoutput
获取TrueCrypt密钥信息 Vol.exe -f Win7_SP1_x86.vmem –profile=Win7SP1x86 truecryptmaster
获取TrueCrypt密码信息 Vol.exe -f Win7_SP1_x86.vmem –profile=Win7SP1x86 truecryptpassphras
|
volatility3的使用
1
2
3
4
5
6
7
8
9
10
11
12
13
14
15
16
17
18
19
20
21
22
23
24
25
26
27
28
29
30
31
32
33
34
35
36
37
38
39
40
41
42
43
44
45
46
47
48
49
50
51
52
53
54
55
56
57
58
59
60
61
62
63
64
65
66
67
68
69
70
71
72
73
74
75
76
77
78
79
80
81
82
83
84
85
86
87
88
89
90
91
92
93
94
95
96
97
98
99
100
101
102
103
104
105
106
107
108
109
110
111
112
113
114
115
116
117
118
119
120
121
122
123
124
125
| 插件名 用法
layerwriter 列出内存镜像 platform 信息,分割 layers
linux.bash 从内存中恢复 bash 命令历史记录
linux.check_afinfo 验证网络协议的操作功能指针
linux.check_syscall 检查系统调用表中的挂钩
linux.elfs 列出所有进程的所有内存映射ELF文件
linux.lsmod 列出加载的内核模块
linux.lsof 列出所有进程的所有内存映射
linux.malfind 列出可能包含注入代码的进程内存范围
linux.proc 列出所有进程的所有内存映射
linux.pslist 列出 linux 内存映像中存在的进程
linux.pstree 列出进程树
mac.bash 从内存中恢复 bash 命令历史记录
mac.check_syscall 检查系统调用表中的挂钩
mac.check_sysctl 检查 sysctl 处理程序的挂钩
mac.check_trap_table 检查 trap 表中的挂钩
mac.ifconfig 列出网卡信息
mac.lsmod 列出加载的内核模块
mac.lsof 列出所有进程的所有内存映射
mac.malfind 列出可能包含注入代码的进程内存范围
mac.netstat 列出所有进程的所有网络连接
mac.psaux 恢复程序命令行参数
mac.pslist 列出 mac 内存映像中存在的进程
mac.pstree 列出进程树
mac.tasks 列出 mac 内存映像中存在的进程
windows.info 显示正在分析的内存样本的 OS 和内核详细信息
windows.callbacks 列出内核回调和通知例程
windows.cmdline 列出进程命令行参数
windows.dlldump 将进程内存范围 DLL 转储
windows.dlllist 列出 Windows 内存映像中已加载的 dll 模块
windows.driverirp 在 Windows 内存映像中列出驱动程序的 IRP
windows.driverscan 扫描 Windows 内存映像中存在的驱动程序
windows.filescan 扫描 Windows 内存映像中存在的文件对象
windows.handles 列出进程打开的句柄
windows.malfind 列出可能包含注入代码的进程内存范围
windows.moddump 转储内核模块
windows.modscan 扫描 Windows 内存映像中存在的模块
windows.mutantscan 扫描 Windows 内存映像中存在的互斥锁
windows.pslist 列出 Windows 内存映像中存在的进程,转储处理可执行映像
windows.psscan 扫描 Windows 内存映像中存在的进程
windows.pstree 列出进程树
windows.registry.certificates 列出注册表中存储的证书
windows.registry.hivelist 列出内存映像中存在的注册表配置单元
windows.registry.hivescan 扫描 Windows 内存映像中存在的注册表配置单元
windows.registry.printkey 在配置单元或特定键值下列出注册表项
windows.registry.userassist 打印用户助手注册表项和信息
windows.ssdt 列出系统调用表
windows.strings 读取字符串命令的输出,并指示每个字符串属于哪个进程
windows.svcscan 扫描 Windows 服务
windows.symlinkscan 扫描 Windows 内存映像中存在的链接
操作
查看映像信息
vol.exe -f xxx.raw windows.info
查看映像进程
vol.exe -f xxx.raw windows.pslist
vol.exe -f xxx.raw windows.psscan
vol.exe -f xxx.raw windows.pstree
查看指定 pid 的进程
vol.exe -f xxx.raw windows.pslist --pid 1234
进程转储
vol.exe -o ./outputdir/ -f xxx.raw windows.pslist --pid 1234 --dump
内存转储
vol.exe -o ./outputdir/ -f xxx.raw windows.memmap --pid 1234 --dump
查看句柄
vol.exe -f xxx.raw windows.handles
vol.exe -f xxx.raw windows.handles --pid 1234
查看 DLL
vol.exe -f xxx.raw windows.dlllist
vol.exe -f xxx.raw windows.dlllist --pid 1234
DLL 转储
vol.exe -o ./outputdir/ -f xxx.raw windows.dlllist --pid 1234 --dump
查看命令行
vol.exe -f xxx.raw windows.cmdline
vol.exe -f xxx.raw windows.cmdline --pid 1234
查看网络端口
vol.exe -f xxx.raw windows.netscan
查看完整的结果,但可能包含垃圾信息和虚假信息 (谨慎使用)
vol.exe -f xxx.raw windows.netscan --include-corrupt
查看注册表信息
vol.exe -f xxx.raw windows.registry.hivescan
vol.exe -f xxx.raw windows.registry.hivelist
查看指定过滤器 (文件夹) 下的注册表信息
vol.exe -f xxx.raw windows.registry.hivelist --filter FILTER
注册表信息转储
vol.exe -o ./outputdir/ -f xxx.raw windows.hivelist --filter FILTER --dump
查看注册表键值对
vol.exe -f xxx.raw windows.registry.printkey
查看指定过滤器 (文件夹) 下的注册表信息,但需要 hivelist 提供的 offset
vol.exe -f xxx.raw windows.registry.printkey --offset OFFSET
查看指定键下的注册表值
vol.exe -f xxx.raw windows.registry.printkey --key KEY
打印所有键的信息
vol.exe -f xxx.raw windows.registry.printkey --recurse
查看文件信息
vol.exe -f xxx.raw windows.filescan
建议通过 powershell 的 Select-String 或者 bash 的 grep 进行搜索,如:
vol.exe -f xxx.raw windows.filescan | grep "flag"
vol.exe -f xxx.raw windows.filescan | Select-String "flag"
文件转储
需要 pslist 提供的 pid
vol.exe -o ./outputdir/ -f xxx.raw windows.dumpfiles --pid 1234
(推荐) 需要 filescan 提供的 offset (一般来说为 physaddr)
vol.exe -o ./outputdir/ -f xxx.raw windows.dumpfiles --virtaddr 0xee1122
vol.exe -o ./outputdir/ -f xxx.raw windows.dumpfiles --physaddr 0xee1122
查找恶意注入代码
vol.exe -f xxx.raw windows.malfind
vol.exe -f xxx.raw windows.malfind --pid 1234
恶意注入代码转储
vol.exe -o ./outputdir/ -f xxx.raw windows.malfind --pid 1234 --dump
库使用方法
有时候我们想要使用 Python 调用 volatility3 来实现一些自动化取证的功能,故在这里记录一下个人经验。
在 volatility3 的文档和代码中,都十分推荐使用 cli 模块的书写方式来编写调用代码。
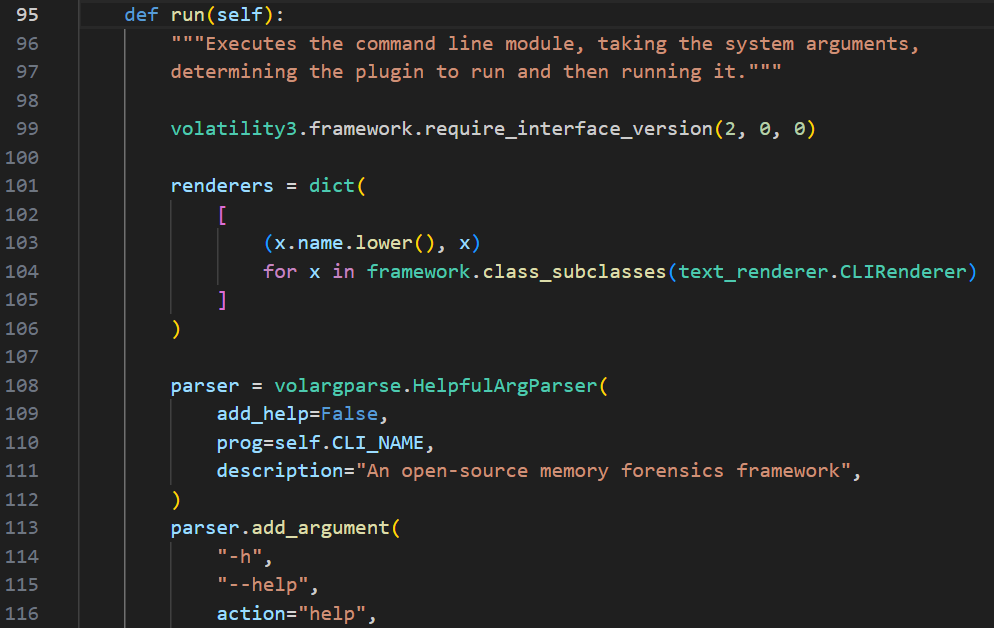
可以定位到 .venv\Lib\site-packages\volatility3\cli\__init__.py,观察 run(self) 代码
|
Slogan:
Do you believe in DESTINY?